Election 2015: Education
This article has been updated.
A quarter of people say education will be very important to them in making their decision about who to vote for in the General Election. Here's our rundown of the claims you're likely to hear on the topic.
Honesty in public debate matters
You can help us take action – and get our regular free email
Apprenticeships
Apprenticeships have changed a great deal since the 1950s, from being three years long and mainly for young people to being shorter and for all ages. There are disagreements over the future of overall funding and whether or not reforms to raise the standards of apprenticeships go far enough. More information is available in our briefing.
Common claims:
"2 million apprenticeships over this Parliament".
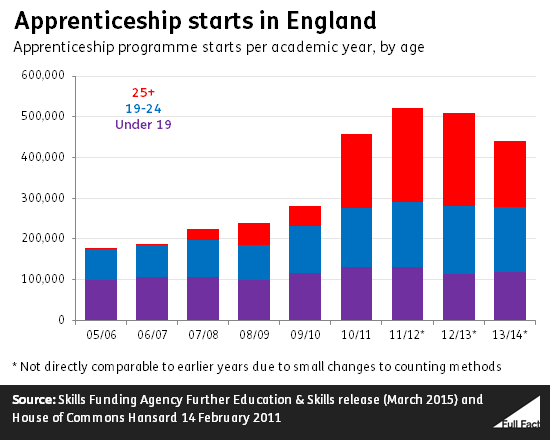
- Over 2 million apprenticeships have been started since May 2010, 177,000 more than the government's target of 2 million (when you include the estimated figures for the 2014/15 academic year).
- But it's the over 24s that have seen the biggest increase, with starts for this age group tripling from 2009/10 to 2013/14, while starts have increased by 3% for the under 19s. Put another way, 4 in 10 of apprenticeship starts since 2010 have been by those aged 25 and over.
- Critics have suggested that adults gaining skills under a previous training scheme are simply being "classified as new apprenticeships". More here.
Free schools and academies
Free schools often start from scratch with just one year's intake in their first year then a two year intake in their second year and so on. Because of this, it means they may not have any older pupils yet—while the schools to which they are compared to do.
Common claims:
"Over 4,000 schools are benefiting from academy status"
- There are just under 4,600 academies open (excluding free schools—of which there are 254)
- We don't know either way about the performance of primary academy schools, because little evidence exists.
- In sponsored secondary academies, school performance has increased more quickly than in similar non-academy schools, according to research by academics at LSE that looks at GCSE results of academies that opened before 2010.
- In converter secondary academies, the evidence is mixed. Research by the National Foundation for Educational Research concluded that academy status had made no difference to the progress made in converter academies at GCSE two years after opening, compared to similar schools in the maintained sector over the same time period.
"The centralised oversight of academies isn't working"
- A report by MPs on the Public Accounts Committee said that oversight bodies had not formally intervened in all academies identified as underperforming. It said that in September 2013 179 open academies should have received formal interventions but only 15 received a warning notice.
- The government said in response that a new management system would aid recordings of interventions in underperforming academies and that a new risk assessment tool had been developed. It also said that the specific circumstances of the school are taken into account when deciding whether and how to intervene.
"Free schools are twice as likely to be rated outstanding by Ofsted" or "Free schools are an expensive flop".
- It's still too early to say if free schools are better or worse than the rest.
- Making comparisons of performance data is problematic, since there are relatively few free schools with evidence available and the schools we have data for may not be fully representative of all free schools.
- The small number of free schools inspected also means that the proportion rated outstanding may be volatile, as the Department for Education has pointed out.
"Free schools are mostly opened in areas in need of places" or "money is being wasted on a few free schools in areas where there are no shortages of places"
- The government has argued that free schools are helping to meet the need for school places. A National Audit Office report from 2013 said that about 70% of the estimated 114,000 primary and secondary places in opened or approved free schools so far are in areas forecasting either high, severe, or moderate need for places.
- A report published by the Public Accounts Committee last year said that more needed to be done to encourage free school applications where they are most needed. The report claimed that no applications to open primary free schools had been submitted in half of areas with a high or severe forecast need for extra school places.
- As of 2014/15 many free schools are not operating at full capacity and haven't been open long enough to fill up with pupils in every year group.
- Since then, the Department has made basic need for places part of the assessment criteria (rather than context) by which free school applications are considered.
"Free schools improve neighbouring schools".
- Near new free schools, bad schools tend to get better and good schools tend to get worse but the evidence doesn't prove that free schools are the cause.
Free school meals
Universal Infant Free School Meals were introduced for all infants in reception, year 1 and year 2 in September 2014.
The policy was introduced to "improve academic attainment and save families money". The Liberal Democrats have pledged to "Extend free school meals to all children in primary education as resources allow and following a full evaluation of free meals for infants".
Common claims:
"Free school meals will improve academic attainment and save families money".
- We don't know yet what impact the policy is having.
- An evaluation of the pilot scheme for Free School Meals found that performance improved. However, this was the impact of the whole scheme, which included other supporting activities conducted alongside the free school meal provision.
- The researchers said they were unable to find "conclusive" evidence that the policy would help to reduce educational inequalities, only "suggestive" evidence. There was also no evidence of any significant health benefits as a result of the scheme, and the research was unable to find the reason behind the improved performance. More here.
Pupil Premium
The Pupil Premium fund was introduced in April 2011 to support the education of disadvantaged children via money separate to the school budget.
Common claims:
"The attainment gap is closing and that's because of policies like the pupil premium".
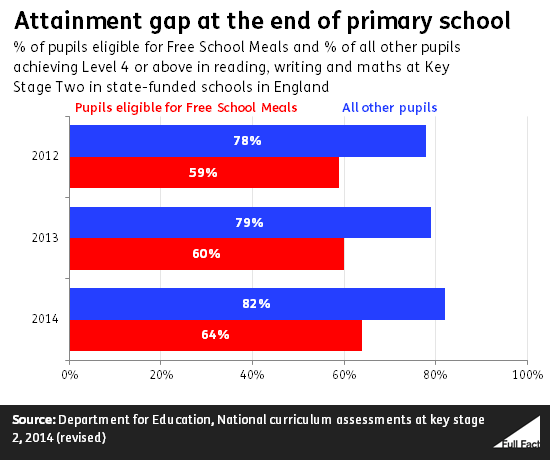
- For primary pupils at their end of school assessment—the figure on which this claim was based—the attainment gap for reading, writing and maths was stagnant from 2012 to 2013 but fell slightly in the last year.
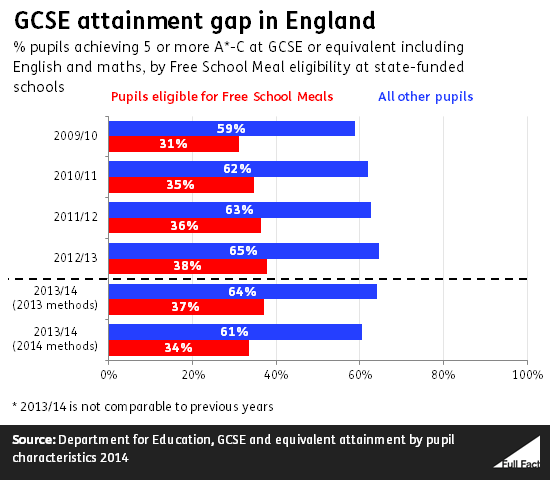
- The GCSE attainment gap (including English and maths) for pupils eligible for free school meals and their peers was falling from 2009/10 to 2011/12, but appears to have increased slightly since then.
- In any case, it's difficult to say what's been happening to any of the attainment gaps as we don't have much comparable data over time, as we've explained in our article.
"The attainment gap is increasing"
- As with the previous claim, it's difficult to say what's been happening to any of the attainment gaps as we don't have much comparable data over time. That's particularly the case with the GCSE figures which were counted differently this year (including the introduction of a cap on GCSE-equivalent qualifications only being able to count as one GCSE).
- The same trends in attainment gaps from the last claim apply to this claim.
Literacy and numeracy
England and Northern Ireland have one of the lowest levels of numeracy skills when compared to other OECD countries. Performance in literacy was about average compared to other OECD countries.
Teenagers in England finish their core learning at an earlier age than other countries, narrowing the topics they study or starting on more specific training between the ages of 16 and 18. Research by the National Foundation for Educational Research has suggested that this could explain the comparatively lower literacy and numeracy performance of young people in England when compared to other high performing OECD countries. But their research also found that when young people do start work they then have to develop these skills pretty quickly.
Common claims:
"Under Labour one in three children left primary school unable to read, write and add up properly, that has now fallen to one in five".
- It's not possible to compare reading, writing and maths performance at age 11 under the Coalition to under the last Labour government.
- Reading and writing have been tested in a different way since 2012, so we can't compare back to test results before then. For example, teachers now mark the writing tests themselves rather than sending them off for external marking.
- So while the one in three and the one in five figures are accurate (it was 36% in 2010 and 21% in 2014), it's not possible to say that this represents a fall.
- The debate is also in what "properly" means—see our earlier piece.
School places
The total state school population is expected to reach over 8 million by 2023. This will be the first time pupil numbers have been so high since the 1970s.
This is putting pressure on school places. On top of plans last reported to the Department for Education, local authorities still need to find space for a further 57,000 primary places by 2015/16 according to the Department's estimates.
Common claims:
"This Parliament has seen double the amount spent on school places that was spent under the last Labour government".
- Basic need funding for school places has increased under the coalition but other funding streams have been cut.
- Over £5 billion was spent on new school places from 2011/12 to 2014/15. That's compared to £1.9 billion of the equivalent spending under Labour in the period 2007/08 to 2010/11, according to the National Audit Office.
- The data only takes us as far back as 2003/04, so it's tricky to assess Labour's overall legacy on the funding of new school places. Full article here.
"Immigration is fuelling the school place crisis".
- The main cause of the increased demand for school places is a substantial increase in the fertility rate between 2001 and 2011.
- Between 2001 and 2011, non-UK born women pushed up the fertility rate as they have a higher fertility rate and made up an increasing share of the population, according to the Office for National Statistics.
- More information here.
"Thousands of children are being taught in oversized infant classes".
- There are three times the number of Key Stage 1 classes (ages 5 to 7) in England with more than 30 pupils—the limit set by government—since January 2010.
- That's up from from 995 to 2,985 in January 2014, according to the most recent figures from the Department for Education.
- That's 5% of all KS1 classes (up from 2%).
Tuition fees
In 2012 the Conservative/Liberal Democrat coalition raised the cap on tuition fees for undergraduate courses to £6,000, rising to £9,000 in "exceptional circumstances"—which the majority of universities are charging.
Common claims:
"We've got record numbers of young people applying to university and record numbers of disadvantaged young people applying to university"
- The application rate for English-resident 18 year-olds was at a record high in January 2015. The application rate did fall after the introduction of higher fees, but the long-term upward trend has continued.
- The rise in application rates for young people in 2010 may have been influenced by the recession, with 18 year-olds choosing to remain in full-time education rather than enter a poor job market.
- 18 year-olds from disadvantaged areas reached their highest ever application rate at the end of the UCAS admissions cycle in 2014, and these gains have continued into the 2015 cycle—the January deadline application rate for this group was also at a record high.
"Young people are leaving university burdened by £44,000 of debt"
- The Institute for Fiscal Studies (IFS) has said that students under the higher fees system will indeed graduate with £44,035 of debt, in 2014 prices.
- It estimates that average total repayments under the new system will be about £22,843.
- But over the longer run, the lowest-earning 30% of graduates who studied full-time will repay less under the new system than they would have under the old, according to estimates by the IFS.
We've got more information on these in our briefing on tuition fees.
Unqualified teachers
Reforms in 2012 meant that schools were given more freedoms to employ unqualified teachers. The government say the reforms give schools the freedom to "appoint the right people to teach their pupils". These moves have been criticised by the Labour party for 'harming standards'—pointing to an increase in the number of unqualified teachers. We've got more here.
Common claims:
"There are 17,000 unqualified teachers in our schools' or 'There are fewer teachers in school without qualified status than in 2010".
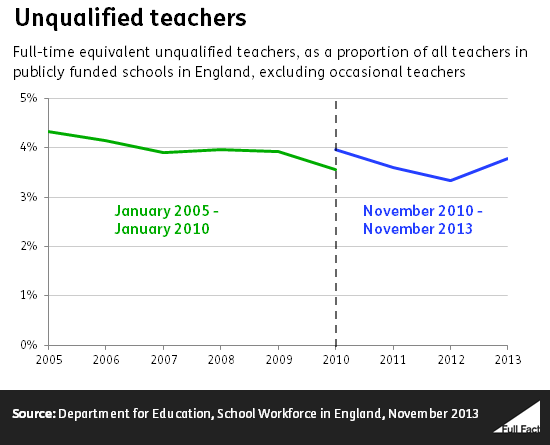
- The most recent figures show that in November 2013, 3.1% of all regular full-time equivalent teachers at local authority maintained schools in England were unqualified, down from 3.7% in November 2010. At academies, 5.3% of regular full-time equivalent teachers were unqualified in 2013, compared to 9.7% in the small number of academies open in November 2010.
- We can't tell what effect the rule changes have had on the number of unqualified teachers yet.
- Looking just since the rule change in 2012, the number of unqualified teachers (full time equivalent) in all state-funded schools in England did go up from 15,000 in 2012 to 17,000 in 2013, a rise of 16%. But that's not particularly significant considering there were 450,000 full-time equivalent teachers working in publicly funded schools in 2013. As a proportion of regular full-time equivalent teachers that was a rise from 3.4% in 2012 to 3.8% in 2013.
We incorrectly said that starts for the over 24s had increased by 70% from 2009/10. The article now correctly states that they tripled.


