“More young people are going to university than ever before, including more young people from disadvantaged backgrounds.”
Justine Greening, 27 June 2017
More 18 year olds are going to university than ever before, as are young people from disadvantaged backgrounds. Participation by disadvantaged young people has levelled off slightly by some measures in the past year, but the longer term picture is generally one of increasing numbers.
Advantaged students are still substantially more likely to go to university than their disadvantaged peers.
This piece looks specifically at the numbers of young people going to university, rather than those applying. We’ve covered that in more detail here. In summary, the number of 18 year olds applying to university across the UK was at a record high in 2017. The application rate in England was also at a record high, though it fell in Wales and Northern Ireland. The proportion of people from disadvantaged backgrounds across the UK applying to university is also at a record high, though these figures only go up to January 2017.
Honesty in public debate matters
You can help us take action – and get our regular free email
Record rate of young people accepted to university in England and Wales
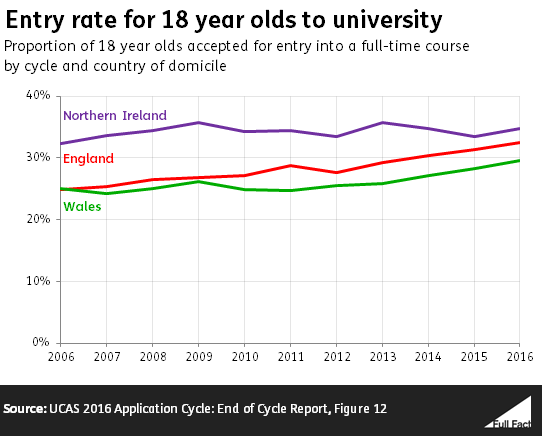
There were 238,900 18 year olds in the UK accepted onto a full-time university course in 2016, the most ever recorded. This made up around half of all acceptances via UCAS that year.
Around 33% of all 18 year olds in England were accepted into a university place in 2016—the highest level recorded. In Wales it was around 30%, again the highest on record.
Entry rates for 18 year olds in Northern Ireland rose to 35% in the year to 2016, the same level as 2014.

We haven't mentioned Scotland here because not all universities in Scotland use UCAS and data issues have affected the comparability of Scottish figures over time.
Of course, some people wait until they’re 19 before starting university. There’s another set of data that includes these people alongside the 18 year olds who started the year before – what’s called the cohort entry rate. This was also the highest on record in England and Wales in the group entering age 18 in 2015 and age 19 in 2016.
This all comes from UCAS data. Separate figures from the government show a similar picture. The government provides data on how many students are living in England who have been in higher education (for the first time) for at least six months and are aged 17-20. This data has the benefit of including part-timers, while the UCAS data relates only to full-time applicants. But it takes a bit longer to get published, so it’s two years behind the UCAS data.
The participation rate for this age group was an estimated 41% in 2014/15 (the latest year available), almost the same as it was in 2011/12 when it was the highest on record. The government statisticians say that particularly high participation in 2011/12 “appears to have been predominantly driven by more students choosing not to defer entry in that year in order to avoid having to pay a higher tuition fee”.
Using the same measure the participation rate for 18 year olds in 2014/15 was 26%, the highest on record and just above what it was in 2011/12.
And the same is true for disadvantaged young people
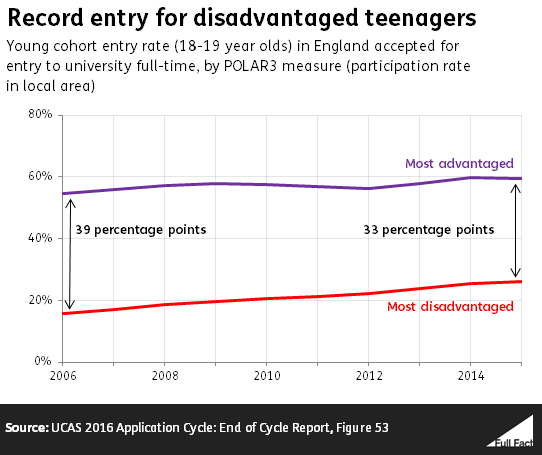
In 2016 the entry rate for 18 year olds living in the most disadvantaged areas increased for all countries in the UK. It increased to the highest on record in England (almost 20%) and Wales (18%). In Northern Ireland it was at 16%, the second highest recorded level.
Disadvantage here is measured according to the rate of participation in higher education by young people in each area, so the most disadvantaged areas are those with the lowest rates of participation by young people.
The rate for those in the most advantaged areas in 2016 increased slightly to 46% in England, Northern Ireland and Wales.
The cohort entry rates (available only for England), show the gap between young people from the most disadvantaged areas and the most advantaged areas going to university is decreasing.

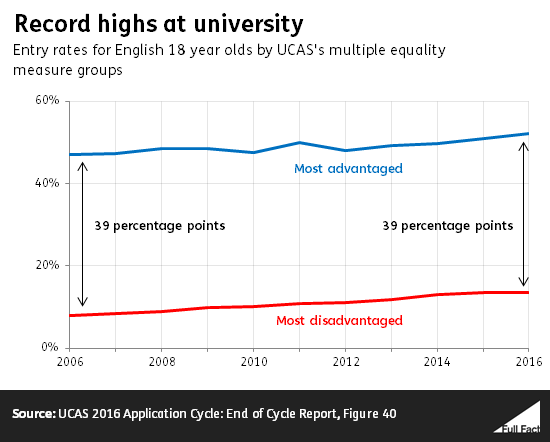
UCAS have also released a new ‘multiple equality measure’ (MEM), for the first time for 2016.
This looks at things like gender, ethnic group, where a person lives, the type of school they go to, and if they got free school meals. Based on a combination of these factors 18 year olds are placed into one of five groups ranging from most to least disadvantaged.
On this measure all five groups have seen growing participation rates, and reached record highs in 2016. That said, the participation rate for the most disadvantaged group has increased more slowly than that of the other groups over the last two years.

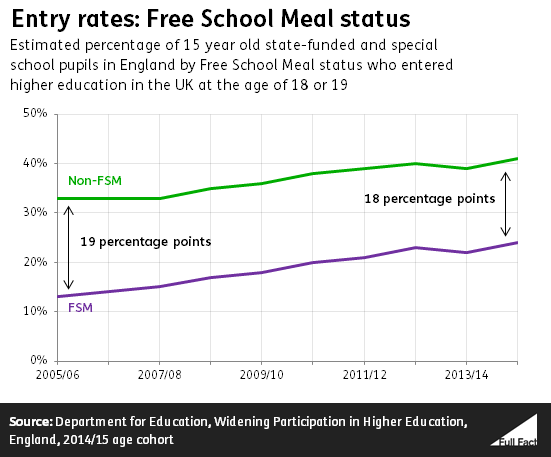
Disadvantage can also be measured by income level, typically measured by whether or not a young person was receiving free school meals at age 15.
The entry rate to university of 18 year old state school pupils in receipt of free school meals was also at a record high in 2016—at about 16%. That's compared to almost 33% for those who didn’t receive free school meals.
The equivalent government measure (which looks at entry to university by age 19) showed a slightly different picture when Ms Greening made her comments. By this measure there was a slight fall in the proportion of pupils receiving free school meals who had gone to university by 2013/14. It decreased by one percentage point to 22%. This decrease was also seen among those not receiving free school meals, so it didn’t change the gap between the two.

The government told us that it can’t say whether or not the introduction of higher tuition fees had an impact on the dip in entry rates for students receiving free school meals who attended university by 2013/14—the first cohort of 18 and 19 year olds to be affected.
Newer figures have become available since which show that this seems to have been a temporary effect and that overall the proportion of people who received free school meals and attend university by the age of 19 is increasing. It was 24% for those attending university by 2014/15.


