Budget 2012 Survival Guide: Is the average taxpayer ever in the middle?
Every budget contains a mixture of sweeteners and sour tastes for the 60 million people living in the UK.
Ministers and analysts often say a measure "will save the average family" a certain amount of money, such as last year's council tax freeze. The Chancellor himself commented in last year's budget statement:
"If you can keep your cost increases low, then we will help you to freeze council tax… the average family will be some £35 better off next year."
The same thing is done for salaries. This Telegraph piece last year reported the average salary for UK full-time workers had fallen by three per cent. They reported the average salary in the UK is £26,200.
Actually, they are talking about the middle or median salary, which is much more typical than the average one.
You probably know without having to look at statistics that income is not evenly balanced across society. A small number of people who earn the most have far larger salaries compared to the majority of people.
When the picture is skewed like this, it isn't actually very helpful to know what the average incomes are. Full Fact Director Will Moy made this point at the Leveson Inquiry last month:
"Famously, the average person has one testicle, but that doesn't tell you very much about people"
In some cases, it is more helpful to look at the median rather than the average. If you imagine lining everybody up in order of how much they earn, then the middle person in the line will better demonstrate what a typical person earns than the person who earns the average amount because a few people at the top earn a huge amount.
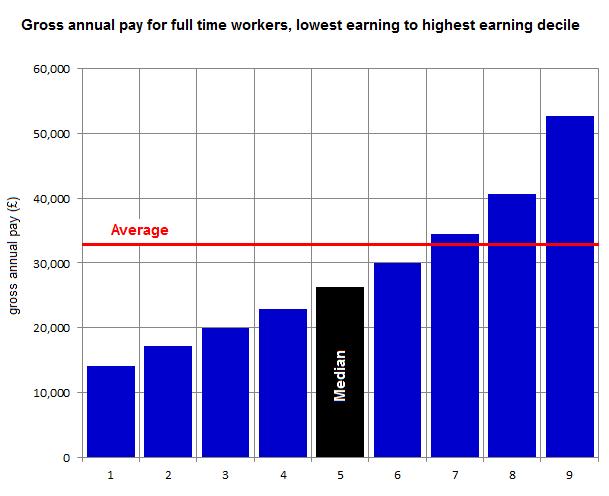
This is shown by looking at earnings distribution, from the Annual Survey of Hours and Earnings:

The red line is the average income, and the black bar (5th decile) shows where the 'middle earner' lies. Our middle earner earns £26,200, which gives us a good idea of what a typical worker might earn. The average pay is £32,800, however around 60 per cent of full time workers earn less than this. This is the effect of a skewed balance towards higher earners.
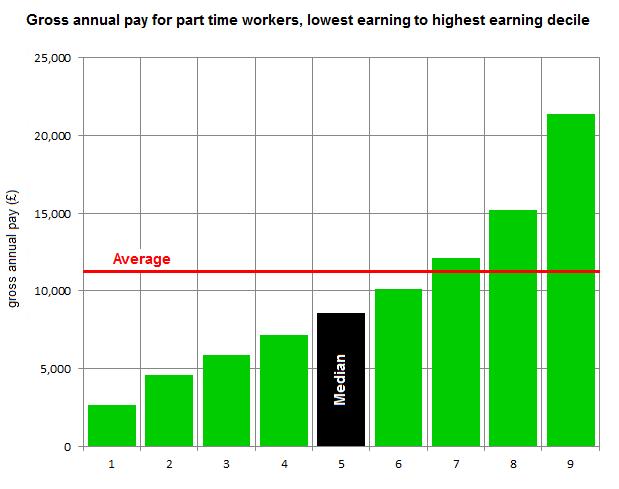
The case is the same for part time workers:

The household story
Another common conflation you will tend to see is between talking about individuals and households. Full Fact discovered the importance of this last month when we found that the Lib Dems' income tax threshold change could be interpreted in two entirely different ways depending on whether you measure its effects by individuals or households.
So if you hear anything in the budget about the average 'family' or 'household', there's probably a different measure at work, although it's important to note that not all households are families.
The situation is broadly the same, however. The highest-earning households earn an especially large amount, making the average unhelpful.
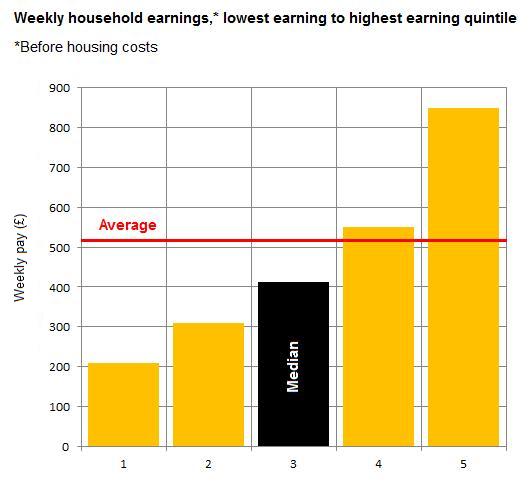
The chart below shows the weekly earnings of UK households, obtained from the Family Resources Survey, split up by quintile (from the 20 per cent lowest earning to the 20 per cent highest earning).

The average UK household earns £517 a week. However only around 40 per cent of households earn more than this. The middle household - with the same number of households earning more and less each way - earns £413.
The 2012 budget - like last year - may well contain references to gains or losses for "the average family" or "average taxpayer". In fact, both the average family and average taxpayer are relatively high-earning compared to most of us.
We actually get a clearer picture of what is happening to the typical family or taxpayer when we look to the middle rather than the average.
In the meantime, try out our budget calculator to get an idea of what the numbers in the budget really mean in the grand scheme of things.